LI: To read the text, gather, sort, graph and analyse the data.
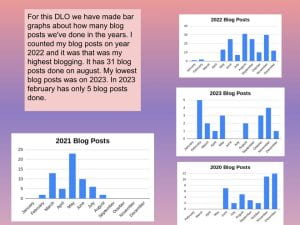
For this task we made a DLO about the blog posts bar graph.
We used google spreadsheets first to make our bar graphs, Then we write how many blog posts we’ve done and add it to the bar graphs. My highest blog posts was on 2022 august, it has 31 blog posts done.
I learnt what mean, median and mode means in maths, mean means the total of the group of numbers divided by how many numbers there are, median means put the number smallest to biggest and find the number in the middle and that is your median. Mode means make the numbers smallest to biggest and count how many numbers are the same for example there are 3 13s. If that number has more of the same number then that is your mode.
I enjoyed this activity because it was interesting to see what was my highest blog posts and what was my lowest blog posts I have done.